

The trends that will shape nature progress in 2024
Following on from January’s World Economic Forum (WEF) annual meeting in Davos, we examine some of the trends that will define nature progress as we look ahead to COP16 later this year.
DNA metabarcoding enables the identification of invertebrate communities at unprecedented scales, effectively overcoming the bottleneck of morphological identification. This unlocks the data potential of highly diverse and responsive groups such as arthropods, which can act as super-indicators of ecological status, facilitating adaptive management.
This article was originally published in the Bulletin of the Chartered Institute of Ecology and Environmental Management (CIEEM), inpractice, Issue 99, Genetic Techniques and Technologies, in March 2018.
Authors: Kat Bruce, NatureMetrics

DNA metabarcoding enables the identification of invertebrate communities at unprecedented scales, effectively overcoming the bottleneck of morphological identification. This unlocks the data potential of highly diverse and responsive groups such as arthropods, which can act as super-indicators of ecological status, facilitating adaptive management during the course of habitat restoration activities in virtually any ecosystem. Ultimately this allows us to learn from failure, improve practice, and obtain better outcomes in biodiversity conservation.
Known as the Field of Dreams hypothesis, an attractive concept in restoration ecology is that once the physical and structural components of a habitat are put in place, the biological elements will inevitably follow. Unfortunately, this does not always hold true (Nilsson et al. 2014, Palmer et al. 2014), yet it is relied upon to such an extent that only a minority of restoration projects implement robust monitoring programmes to evaluate success (Huddart et al. 2016).
Instead, outcomes are frequently assessed on the basis of broad surrogates of biodiversity that are largely structural in nature, with no direct consideration of any aspect of species diversity beyond the classification of vegetation (e.g. Defra 2012).
The lack of monitoring and reporting of restoration outcomes is damaging at two levels. At the project level it reduces the potential for adaptive management, which is likely to be required for a truly successful outcome given the complexity of the natural ecosystems that projects seek to replicate (Cooke and Johnson 2002, Hilderbrand et al. 2005). At a higher level, it hampers the development of a conceptual framework for restoration ecology by limiting the ability of the scientific and practitioner community to learn from the successes and failures of past projects (Chapman and Underwood 2000, Lake 2001, Palmer et al. 2007, Suding 2011).
As the concepts of no net loss, net gain, and biodiversity offsetting gain increasing traction in environmental management, it’s vital that we develop the tools to address this issue and ensure that outcomes are properly assessed. Otherwise we risk masking high background rates of biodiversity decline with the appearance of having achieved positive outcomes.
We need to be able to generate direct biodiversity data across a wide range of taxonomic groups and at large spatial and temporal scales.
That said, we cannot realistically monitor everything, meaning we usually need to choose some representative taxa to serve as indicators of wider biodiversity trends. This is challenging to do well – as is clear from Lake’s (2001) summary of desirable indicator attributes: ‘they must have no taxonomic difficulties or measuring uncertainties; they need to be sensitive to the restoration measures; they need to respond at different rates over different time spans; and preferably they need to be linked with each other in their ecological functioning’. In practice, indicator attributes are rarely considered beyond ease of measurement. Most indicator-based assessments measure a narrow group of organisms, with the implicit – and invalid (Lindenmayer et al. 2002) – assumption that other groups will follow the same trends.
Thus, the responses of most components of biodiversity usually remain unknown. Importantly, this includes groups such as terrestrial invertebrates and soil biota, which are likely to be of functional importance in the ecosystem and to influence its long-term viability.
Here, we advocate using arthropods as a super-indicator of habitat type and condition. Arthropods are abundant, diverse and can be captured in large numbers from virtually any terrestrial or aquatic ecosystem. They perform many ecological functions, exhibit a wide range of tolerances, and have relatively short generation spans, meaning that they respond quickly to environmental changes. Species turnover along ecological gradients is usually significant, and invertebrate communities are already used to infer ecological condition of aquatic ecosystems. Moreover, the functions and ecology of arthropod species are generally quite well known, which lends additional insight to analysis (e.g. Heaver et al. 2017). In short, arthropods meet Lake’s (2001) criteria in most respects.
Of course, the problem is identification. There are over 26,000 species of British insects (Buglife 2017), and keying out to species often involves microscopic examination of characters such as distribution of bristles, wing-vane patterns, or genital morphology (e.g. Langton and Pinder 2007). The expertise needed to identify invertebrate specimens trapped in large-scale monitoring programmes is simply not available. Even if it were, conventional taxonomy would be too slow to provide useful data within the timeframe required for decision-making, and the labour involved would be prohibitively expensive.
DNA metabarcoding is a powerful tool that enables the taxonomic bottleneck to be overcome, so that large and diverse collections of invertebrates can be transformed into useable ecological data within a useful timeframe, yielding large datasets with high statistical power.
The approach uses high-throughput sequencing technology to sequence the barcode genes of many different organisms in parallel, revealing the species composition of complex samples such as those gathered in insect traps (see Box 1 for details of the key steps). Hundreds of samples can be analysed in just a few weeks, and based on the current completeness of reference databases, around 70-80% of terrestrial macroinvertebrates can be identified to species level, with the remainder assigned to higher taxonomic levels. The key output from metabarcoding is a species-by-sample table that can be used as input for any conventional community analysis (Figure 1).
Our research has shown that the ecological information returned by metabarcoding is at least as good as that derived from gold standard morphological taxonomy, with great advantages in terms of both time and cost (Ji et al. 2013), especially when there are large numbers of samples to be processed.

Figure 1. Part of a species-by-site table derived from metabarcoding of pitfall traps. Each of the last seven columns represents a single pitfall trap, and numbers represent the number of sequences identified as each species in each sample.
Click the table to open a larger version in a new tab.
Ideally, monitoring in a restoration project (or indeed any management intervention)
would follow an extended Before-After-Control-Impact (BACI) design. This means replicated monitoring of arthropod communities before, during and after intervention in:
Let’s assume we’ve followed the BACI design described above, with several sample replicates collected at each site (restoration, control, target). The samples have been processed following the metabarcoding workflow described in Box 1, and a presence-absence dataset of arthropods has been generated.
We expect that the arthropod communities in the control and target habitats will differ substantially from one another and that this difference will be maintained for the duration of the project. The community in the restoration area should resemble the control community at the outset but become more like the target community over time as a result of restoration activities.
Ordination plots based on methods such as non-metric multidimensional scaling (NMDS) or principal components analysis (PCA) are very useful for visualising this. These plots arrange samples in an abstract space based on pairwise similarity of their species lists. Thus, samples with many species in common will lie close together in the plot, while those with few species in common will be positioned far apart. If multiple samples are analysed in each of two different habitats, we expect samples from the same habitat to cluster together (as shown in Figure 2), since species composition will be more similar within habitat than between habitats.

Figure 2. Schematic ordination plot showing the similarity of communities sampled in control and target habitats. The arrow indicates the expected direction of movement of the focal communities, which become more like the target communities over time. See text for further explanation.
We can think of the area where the samples of a particular habitat cluster in the ordination space as the ‘biodiversity fingerprint’ of the habitat. In reality, this captures the set of species that are characteristic of that environment. What we are trying to achieve through management is to move the biodiversity fingerprint of the restoration area in the direction of the target fingerprint, until they overlap completely and there is no longer any statistical difference between the communities (assessed using permutation tests, multivariate generalised linear models, or similar).
One of the principal advantages of a comprehensive, on-going monitoring programme is that it facilitates adaptive management. This is the process by which the effects of an intervention are monitored to assess how well they are working, and the management plan is adapted accordingly to ensure the best possible outcome. Figure 3 illustrates a scenario in which one group of organisms (flying insects) has initially responded well to the restoration effort, while another group (ground arthropods) has not.
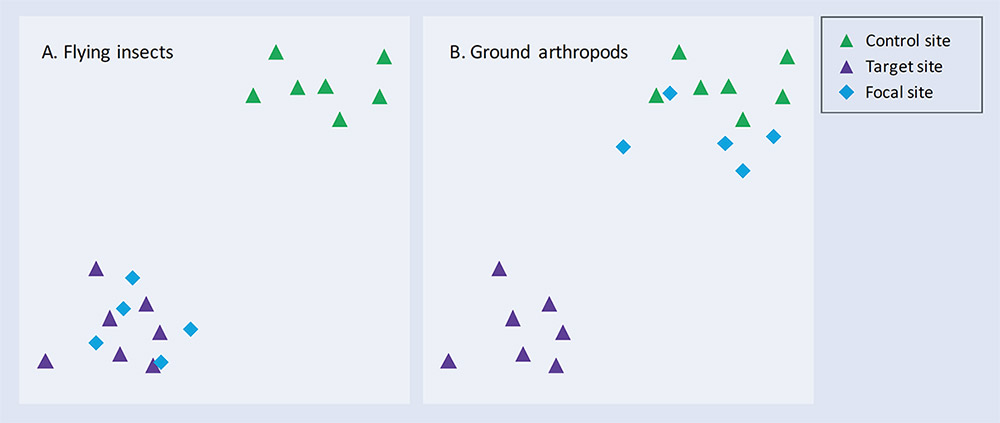
Figure 3. Schematic ordination plots showing communities of (A) flying insects and (B) ground arthropods in Control, Target and Restoration (Focal) sites at a single time point. See text for further explanation.
Recognising during the project cycle that the management plan is not succeeding for ground arthropods allows ecologists to examine the reasons and try to address them. Perhaps the ground habitat is not yet appropriate for the species that characterise the target habitat, or maybe a connectivity issue is preventing these species from colonising the new habitat. Quite possibly some simple adjustments to the management of the site could improve its suitability for this group and deliver a far better overall outcome in terms of the functioning and diversity of the new habitat.
While metabarcoding won’t be the ideal approach in all scenarios – for instance where precise abundance data is needed – it allows ecologists to gather and use data on arthropod communities even when they don’t have access to expert taxonomists. More generally, it enables direct biodiversity data to be obtained on unprecedented scales in virtually any habitat. This allows us to move towards adoption of a ‘black box thinking’ approach (Syed 2016), whereby high resolution data is gathered during the course of operations, and used to help understand our failures, adapt our practices, and continually improve our chances of success in managing the natural environment.
The most important thing to remember is that formalin should never be used on samples that are intended for DNA analysis. Denatured alcohols and ethylene glycol are poor preservatives in the medium and long term. Ethanol is the ideal preservative but not always practical or possible to use. Other salt- and detergent-based preservatives can usually be supplied by laboratories, and propylene glycol is an effective and accessible alternative.
The analysis returns the number of sequences identified as each species on a per sample basis. Although it is tempting to interpret this as a proxy for abundance or biomass, it’s important to bear in mind that unavoidable biases introduced during the laboratory process can have a major effect on this relationship. This is primarily due to the fact that some species amplify more readily than others during the PCR step. The most conservative approach is to analyse the data in terms of presence-absence. Due to the number of taxa included in the analysis, presence-absence data still has high statistical power for demonstrating change. If abundance data for particular species is important to the project, then incidence across multiple samples can be used as a proxy for abundance (e.g. a species detected in every sample replicate is likely to be more abundant than one found only in a small proportion of replicates). Alternatively, this may be a scenario in which conventional methods are the best.
Currently about 80% of terrestrial arthropods in the UK can be identified to species level based on public reference databases. For species that are not in the reference database, identifications are returned at higher taxonomic levels, such as genus or family. These are still presented in the dataset as species-level entities and they will be assigned an identifier so that they can be tracked across different samples. In this way they can be thought of as similar to morphospecies. It is always an option to add to reference databases throughout the monitoring programme by morphologically identifying a subset of samples and sequencing the identified individuals to generate new barcodes where there are gaps. New taxonomic information can be added retrospectively to existing metabarcoding datasets by re-running the last step of the bioinformatics pipeline with the latest reference library, so an incomplete reference database should not be an obstacle to beginning a monitoring programme using metabarcoding.
Absolutely not. The best projects will combine the large-scale capabilities of metabarcoding with more detailed morphological analysis of a subset of samples. This allows validation of the metabarcoding output and improvement of local reference databases, as well as acquisition of abundance and trait data.
This is proving very difficult for a variety of reasons, mostly associated with the taxonomic breadth of the group, which makes it difficult to target macroinvertebrates while avoiding zooplankton and microorganisms. These tend to dominate the data and overwhelm the macroinvertebrate eDNA.
Buglife (2017). Main groups of insects. Available here. Accessed 15 December 2017.
Chapman, M.G. and Underwood, A.J. (2000). The need for a practical scientific protocol to measure successful restoration. Wetlands (Australia), 19: 28-49.
Cooke, J.A. and Johnson, M.S. (2002). Ecological restoration of land with particular reference to the mining of metals and industrial minerals: a review of theory and practice. Environmental Reviews, 10: 41-71.
Defra (Department for Environment, Food and Rural Affairs) (2012). Technical paper: the metric for the biodiversity offsetting pilot in England. Biodiversity Offsetting Pilots. Department for Environment, Food and Rural Affairs, London. Available here. Accessed 24 January 2018.
Heaver, D., Webb, J., Roy, D., Dean, H., Harvey, M., Macadam, C. and Curson, J. (2017). Pantheon: A New Resource for Invertebrate Survey Standards and Analysis. In Practice – Bulletin of the Chartered Institute of Ecology and Environmental Management, 98: 25-29.
Hilderbrand, R.H., Watts, A.C. and Randle, A.M. (2005). The myths of restoration ecology. Ecology and Society, 10: 19-29
Huddart, J.E.A., Thompson, M.S.A., Woodward, G. and Brooks, S.J. (2016). Citizen science: from detecting pollution to evaluating ecological restoration. WIREs Water, 3: 287-300.
Ji, Y., Ashton, L., Pedley, S.M., Edwards, D.P., Tang, Y., Naamura, A., Kitching, R., Dolman, P.M., Woodcock, P., Edwards, F.A., Larsen, T.H., Hsu, W.W., Benedick, S., Hamer, K.C., Wilcove, D.S., Bruce, C., Wang, X., Levi, T., Lott, M., Emerson, B.C. and Yu, D.W. (2013). Reliable, verifiable and efficient monitoring of biodiversity via metabarcoding. Ecology Letters, 16(10): 1245-1257.
Lake, P.S. (2001). On the maturing of restoration: linking ecological research and restoration. Ecological Management and Restoration, 2: 110-115.
Langton, P.H. and Pinder, L.C.V. (2007). Keys to the Adult Male Chironomidae of Britain and Ireland, Vol 1 and 2. Freshwater Biological Association, Ambleside.
Lindenmayer, D.B., Manning, A.D., Smith, P.L., Possingham, H.P., Fischer, J., Oliver, I. and McCarthy, M.A. (2002). The focal-species approach and landscape restoration: a critique. Conservation Biology, 16(2): 338-345.
Nilsson, C., Polvi, L.E., Gardeström, J. and Hasselquist, E.M. (2014). Riparian and in-stream restoration of boreal streams and rivers: success or failure? Ecohydrology, 8(5): 753-764.
Palmer, M.A., Allan, D., Meyer, J. and Bernhardt, E.S. (2007). River restoration in the twenty-first century: data and experiential knowledge to inform future efforts. Restoration Ecology, 15(3): 472-481.
Palmer, M.A., Hondula, K.L., and Koch, B.J. (2014). Ecological restoration of streams and rivers: shifting strategies and shifting goals. Annual Review of Ecology, Evolution and Systematics, 45: 247-269.
Suding, K.N. (2011). Toward an era of restoration in ecology: successes, failures, and opportunities ahead. Annual Review of Ecology, Evolution, and Systematics, 42: 465-487.
Syed, M. (2016). Black Box Thinking, John Murray, London.

Kat is co-founder and CEO of NatureMetrics, a company that specialises in DNA-based Monitoring of biodiversity.
An ecologist by training, her PhD at the University of East Anglia centred on the use of invertebrate metabarcoding to inform environmental management activities and facilitate evidence-based decision-making.
Contact Kat at: kat@naturemetrics.co.uk
.jpg)
Following on from January’s World Economic Forum (WEF) annual meeting in Davos, we examine some of the trends that will define nature progress as we look ahead to COP16 later this year.


