

The trends that will shape nature progress in 2024
Following on from January’s World Economic Forum (WEF) annual meeting in Davos, we examine some of the trends that will define nature progress as we look ahead to COP16 later this year.
One of the best-developed applications of eDNA is surveying fish communities. Fish are particularly well suited to eDNA monitoring because they are fully aquatic and consistently release DNA into the water, making them detectable year-round
This article was originally published in the Bulletin of the Chartered Institute of Ecology and Environmental Management (CIEEM), inpractice, Issue 99, Genetic Techniques and Technologies, in March 2018.
One of the best-developed applications of eDNA is surveying fish communities. Fish are particularly well suited to eDNA monitoring because they are fully aquatic and consistently release DNA into the water, making them detectable year-round. Most UK freshwater fish can be identified to species using the 12S gene, for which well-validated metabarcoding assays exist. This enables all fish DNA in a water sample to be amplified and sequenced in parallel, efficiently yielding whole community data.
Extensive testing by the Environment Agency (in collaboration with the University of Hull and CEH) has shown that eDNA metabarcoding is more sensitive than conventional gillnetting for monitoring lake fish communities. In addition, it is far less invasive and substantially cheaper (Environment Agency 2016, Hänfling et al. 2016). The Scottish Environment Protection Agency (SEPA) are now employing the eDNA approach on a larger scale to gather data on fish communities in Scottish lakes.
The eDNA in ponds and lakes does not move far from the location in which it was shed (Lacoursière-Roussel et al. 2016). Consequently, quite fine-scale data can be obtained on the spatial distribution of aquatic species. At the same time, it makes it vital that samples (or sub-samples) are collected from around the whole perimeter of the waterbody in order to avoid missing species that may have a localised distribution.
DNA travels downstream in running water, so an eDNA sample will capture the species in the area directly upstream of the sampling site. Usually the transport distance varies from a few hundred metres to a few kilometres (Civade et al. 2016), after which it settles out into the sediment and can no longer be detected in the water column (Shogren et al. 2017). The exact distance that DNA travels is influenced by a great many factors including flow rate, depth, substrate, water chemistry and environmental conditions (Jane et al. 2014, Shogren et al. 2017), so there will always be some level of uncertainty regarding the precise spatial representation of an individual sample. Nonetheless, a sample is likely to be dominated by the DNA of fish that are closer to the sampling point.
Civade et al. (2016) found that a single eDNA sampling campaign in an Alpine river captured as much data as 20 cumulative years of conventional monitoring. In particular, the approach is extremely powerful for determining the ability of fish species to migrate upstream and to pass structures that may represent barriers (Jerde et al. 2011). In a pilot project currently underway with Natural England, NatureMetrics will monitor key species of migratory fish along rivers using eDNA.
Fish diversity in oceans is high, and eDNA can be moved around by currents and tides leading to some spatial uncertainty. However, studies have shown that communities detected by eDNA are dominated by species typical of the local environment in which the sample was collected (e.g. O’Donnell et al. 2017).

Figure 1. Column chart showing the relative abundance of fish species in a small lake based on counts of fish (blue) and DNA sequences (orange).
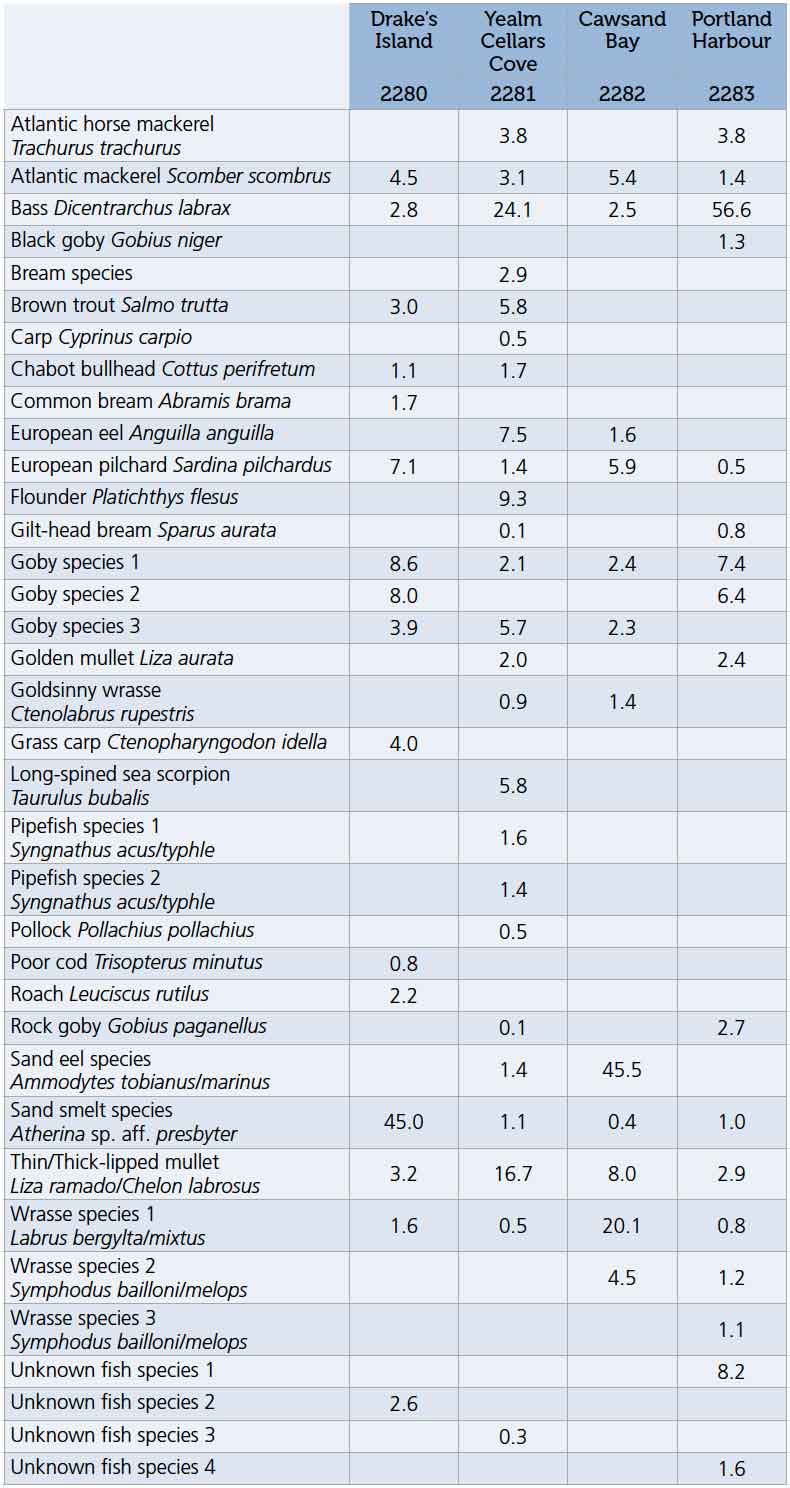
Table 1 shows the diversity detected in four seawater samples collected from coastal seagrass beds in Devon in a recent collaboration between the Community Seagrass Initiative and NatureMetrics. A total of 36 different taxa were detected across the four samples, with a maximum of 25 taxa in a single sample. This dataset illustrates several points:
Table 1. Species-by-sample table generated by 12S eDNA metabarcoding of water samples collected at four seagrass beds on the south coast of England. Numbers give the percentage of the sequences in the sample assigned to each species.
Various factors influence the amount of DNA that fish release into the environment, including size (surface area and biomass), stress levels, life cycle, and behaviour. Indeed, changes in feeding rate can affect DNA shedding rate by an order of magnitude (Klymus et al. 2015). Nonetheless, the relative abundance of sequence reads obtained from metabarcoding tends to correlate with the relative dominance of the species, at least for communities in standing water (Hänfling et al. 2016, Lacoursière-Roussel et al. 2016).
In November 2017, NatureMetrics visited the Environment Agency’s fish farm facility at Calverton, Nottinghamshire, to take water samples from a lake on the same day that the fish were removed from it and counted. Figure 1 shows the relative abundance of fish (as counted) against the relative abundance of sequence reads obtained by metabarcoding. It is clear that the sequence data accurately tells us which are the dominant fish species and which are present at a lower level. Consistent with published research, this suggests that the laboratory workflow for metabarcoding fish does not introduce large biases.
We would still urge caution in quantitative interpretations of metabarcoding data. In more complex environments – especially running water – the match is likely to be less reliable. Moreover, a single sample can be strongly influenced by localised events such as spawning, so interpretations should always be based on multiple samples. In standing water, the approach taken by the Environment Agency and SEPA is to collect samples from multiple points around the perimeter of a waterbody to analyse site occupancy (Environment Agency 2017). Given that DNA remains quite locally distributed in still water, the more abundant species will occur in a greater proportion of the samples than will the rarer species.
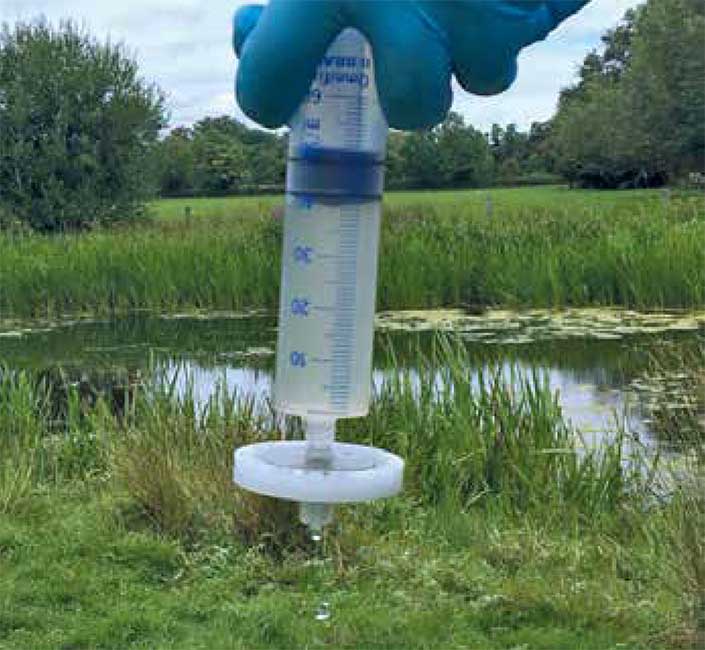
Fishing with eDNA – manual filtration of pond water for conducting a fish survey.
Photo credit Kat Bruce.
Fish eDNA metabarcoding is a powerful method that allows fish species composition to be determined without the need for expensive equipment or invasive methods. The relative abundance of sequence reads assigned to each species can be considered a fairly accurate
reflection of the relative amounts of DNA captured, and this tends to correlate positively with the relative abundance of fish. When working in running water or oceans, there is inherently a greater degree of uncertainty regarding the relative abundance and spatial distribution of species than is the case in standing water, and this should be taken into account when interpreting results. However, eDNA metabarcoding will allow data on fish species composition to be obtained where it would otherwise have been unfeasible, and for this reason it represents an important new tool in the ecologist’s armoury.
Kat is co-founder and CEO of NatureMetrics, a company that specialises in DNA-based Monitoring of biodiversity.
An ecologist by training, her PhD at the University of East Anglia centred on the use of invertebrate metabarcoding to inform environmental management activities and facilitate evidence-based decision-making.
Contact Kat at: kat@naturemetrics.co.uk

CT is a senior scientist at NatureMetrics and specialises in DNA-based Approaches to characterising biodiversity.
He’s developed molecular techniques to identify fish communities from water, plants from soil, arthropods from traps, and even bat, bird, and otter diets from their faeces.
Contact CT at: ct@naturemetrics.co.uk

Mark is Project Manager for the Community Seagrass Initiative, a Heritage Lottery Funded citizen science engagement and monitoring project. The project focuses on sub tidal Zostera marina beds in South West England as a focus for UK Biodiversity Action Plan Species habitat.
Contact Mark at: mark.parry@national-aquarium.co.uk

Civade, R., Dejean, T., Valentini, A., Roset, N., Raymond, J.-C., Bonin, A., Taberlet, P. and Pont, D. (2016). Spatial representativeness of environmental DNA metabarcoding signal for fish biodiversity assessment in a natural freshwater system. PLoS ONE, 11(6): e0157366.
Environment Agency (2016). A DNA-based Monitoring Method for Fish in Lakes: Project summary SC140018. Available here. Accessed 20 January 2018
Environment Agency (2017). eDNA-based metabarcoding as a monitoring tool for fish in large lakes: Report SC140018. Available here. Accessed 20 January 2018.
Hänfling, B., Lawson Handley, L., Read, D.S., Hahn, C., Li, J., Nichols, P., Blackman, R.C., Oliver, A. and Winfield, I. (2016). Environmental DNA metabarcoding of lake fish communities reflects long-term data from established survey methods. Molecular Ecology, 24(13): 3101-3119.
Jane, S.F., Wilcox, T.M., McKelvey, K.S., Young, M.K., Schwartz, M.K., Lowe, W.H., Letcher, B.H. and Whiteley, A.R. (2014). Distance, flow and PCR inhibition: eDNA dynamics in two headwater streams. Molecular Ecology Resources, 15(1): 216-227.
Jerde, C.L., Mahon, A.R., Chadderton, W.L. and Lodge, D.M. (2011). Sight unseen: detection of rare aquatic species using environmental DNA. Conservation Letters, 4(2): 150-157.
Klymus, K.E., Richter, C.A., Chapman, D.C. and Paukert, C. (2015). Quantification of eDNA shedding rates from invasive bighead carp Hypophthalmichthys nobilis and silver carp Hypophthalmichthys molitrix. Biological Conservation, 183: 77-84.
Lacoursière-Roussel, A., Côté, G., Leclerc, V. and Bernatchez, L. (2016). Quantifying relative fish abundance with eDNA: a promising tool for fisheries management. Journal of Applied Ecology, 53: 1148-1157.
Miya, M., Sato, Y., Fukunaga, T., Sado, T., Poulsen, J.Y., Sato, K., Minamoto, T., Yamamoto, S., Yamanaka, H., Araki, H., Kondoh, M. and Iwasaki, W. (2015). MiFish, a set of universal PCR primers for metabarcoding environmental DNA from fishes: detection of more than 230 subtropical marine species. Royal Society open science, 2: 150088. http://dx.doi.org/10.1098/rsos.150088. Available at http://rsos.royalsocietypublishing.org/content/2/7/150088.article-info. Accessed 23 January 2018.
O’Donnell, J.L., Kelly, R.P., Shelton, A.O., Samhouri, J.F., Lowell, N.C. and Williams, G.D. (2017). Spatial distribution of environmental DNA in a nearshore marine habitat. PeerJ, 5: e3044.
Shogren, A.J., Tank, J.L., Andruszkiewicz, E., Olds, B., Mahon, A.R., Jerde, C.L. and Bolster, D. (2017).
Controls on eDNA movement in streams: transport, retention and resuspension. Scientific Reports, 7: 5065
Table 1. Species-by-sample table generated by 12S eDNA metabarcoding of water samples collected at four seagrass beds on the south coast of England. Numbers give the percentage of the sequences in the sample assigned to each species.
.jpg)
Following on from January’s World Economic Forum (WEF) annual meeting in Davos, we examine some of the trends that will define nature progress as we look ahead to COP16 later this year.


